COURSE READING AND WORKSHEETS
How to analyze a SaaS funnel and choose what to fix
To analyze a SaaS funnel, define the customer journey and measurement window, check that the data is trustworthy, calculate conversion between steps, and estimate what an improvement would produce downstream. Then investigate the most promising bottlenecks with customer evidence.
The lowest conversion rate is a starting point for questions. It isn't automatically the best place to spend your time.
Define what you're counting
A self-serve funnel might be visit → signup → first useful result → paid customer. A sales-led funnel might be inquiry → qualified conversation → evaluation → purchase.
Choose the unit that matches the decision. A collaborative product may need an account-level funnel rather than a user-level funnel. Website visitors and purchasing companies are different units; joining them requires an explicit identity method.
Write down the meaning of every step. “Activated” could mean a successful API call, an imported dataset, or a completed report. Choose behavior that represents meaningful product value, then investigate whether it is associated with later use and retention.
Also define the time window. A signup from yesterday has had less chance to convert than one from a month ago. Comparing immature cohorts with mature ones can make a healthy funnel look broken.
Check the measurement before diagnosing behavior
Look for missing events, duplicate events, internal/test accounts, identity problems, and changes in tracking definitions. Walk through the product and verify that the expected events appear once, with the correct account and timestamp.
If a deployment changed tracking at the same time conversion dropped, inspect that first. A report can show fewer activations because the event stopped firing rather than because customers stopped succeeding.
Make sure the funnel counts ordered progression within the chosen window. A dashboard that independently counts visits, signups, and payments during one month may mix unrelated people and older customers.
Calculate conversion between steps
For an ordered funnel:
> Step conversion = people or accounts reaching the next step ÷ eligible people or accounts at the previous step.
Here is a fictional funnel with resolved user identities and the same observation window for all steps. Counts are cumulative: each later group passed through the earlier steps.
| Step | Count | Conversion from previous step |
|---|---|---|
| Eligible visitors | 2,000 | — |
| Signups | 100 | 5% |
| Activated users | 40 | 40% |
| New paying customers | 10 | 25% |
Visitor-to-paid conversion is 10 / 2,000 = 0.5%.
These numbers are illustrative. They are not SaaS benchmarks and should not be used to label another business's funnel good or bad.
Estimate downstream impact
Suppose you could increase signup conversion from 5% to 6%. With the same visitor count, that produces 120 signups. If the later rates remain unchanged, the expected result is:
> 2,000 × 6% × 40% × 25% = 12 paying customers.
That is two additional customers in the model.
Now suppose you improve activation from 40% to 50%, keeping the original signup rate:
> 2,000 × 5% × 50% × 25% = 12.5 expected paying customers.
The fractional result is an expectation across repeated comparable cohorts, not half a customer you will observe. Actual counts will be whole numbers and will vary.
Finally, increasing activated-to-paid conversion from 25% to 35% gives:
> 2,000 × 5% × 40% × 35% = 14 expected paying customers.
| Scenario | Expected paid customers | Increase from baseline |
|---|---|---|
| Baseline | 10 | — |
| Signup conversion reaches 6% | 12 | 2 |
| Activation reaches 50% | 12.5 | 2.5 |
| Activated-to-paid reaches 35% | 14 | 4 |
The model helps compare possibilities. It doesn't prove which change is achievable. Increasing signups can change customer quality and later conversion rates. Helping more users activate may bring in users with different willingness to pay. Test those assumptions.
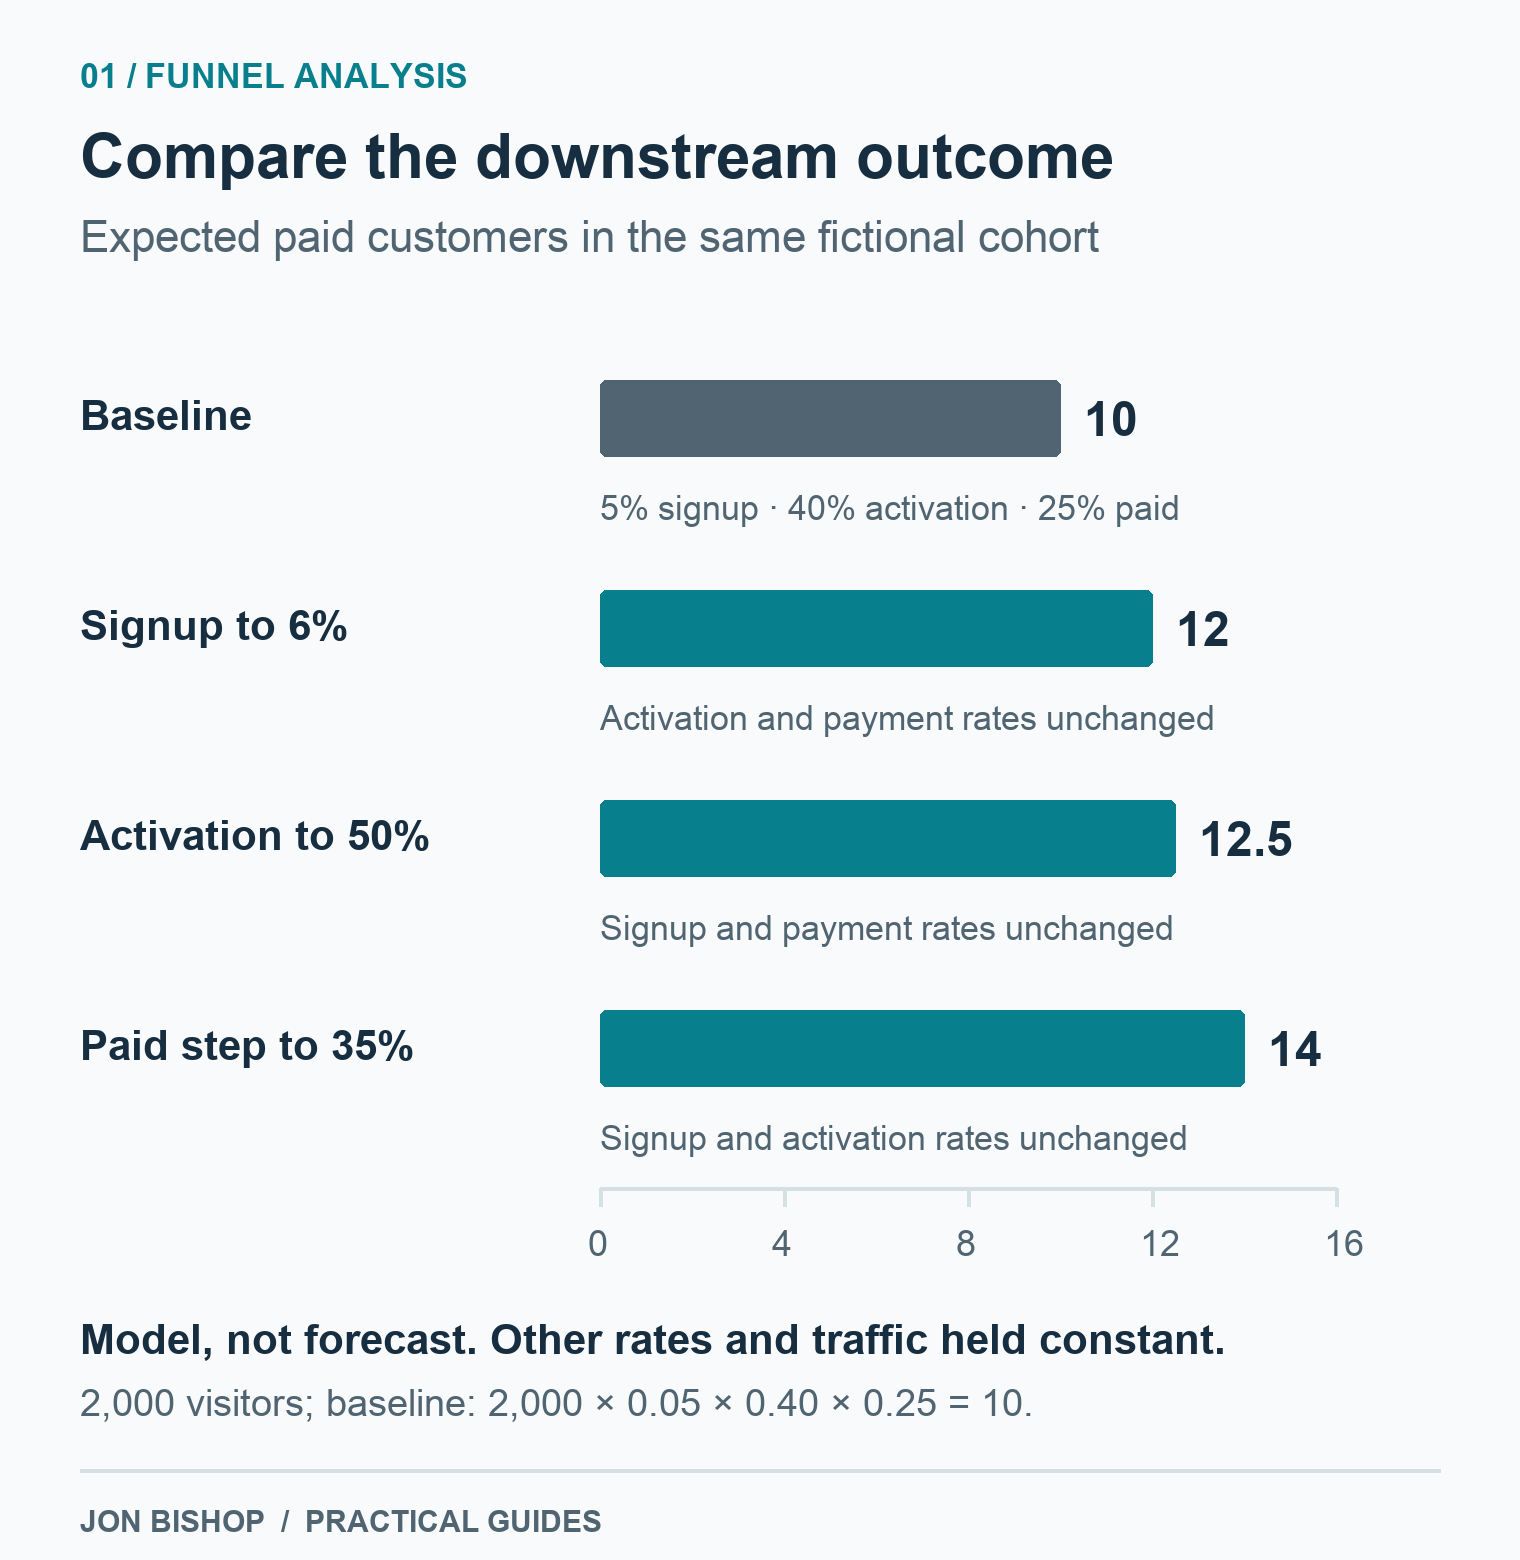
Fictional scenario comparison. Bars start at zero; traffic and the other conversion rates stay constant. These are modeled outcomes, not observed results.
Compare achievable changes, not just modeled lift
The payment scenario produces the largest modeled increase, but imagine that it requires changing packaging and a purchasing process you do not yet understand. The signup scenario might address a reproduced form error with a much smaller implementation effort. In that fictional situation, fixing the error is a reasonable first action even though its modeled lift is lower.
Record the evidence behind each proposed rate change. “Six people encountered the same setup error” supports investigating that error; it does not establish that removing it will raise activation to 50%. Separate the diagnostic finding from the scenario assumption.
If the previous-step count is zero, conversion is undefined. Report the counts and investigate eligibility or collection rather than displaying a misleading 0% rate.
Keep percentage points and relative improvement distinct
Going from 5% to 6% is an increase of one percentage point, or a 20% relative increase: (6% - 5%) / 5%.
That distinction matters when discussing goals. A small-looking percentage-point change can require a substantial behavioral improvement.
Avoid using a third-party average as your target without checking its population, product model, event definitions, and observation window. Your own comparable historical cohorts can be a more useful starting point, although changes in traffic mix and product experience still matter.
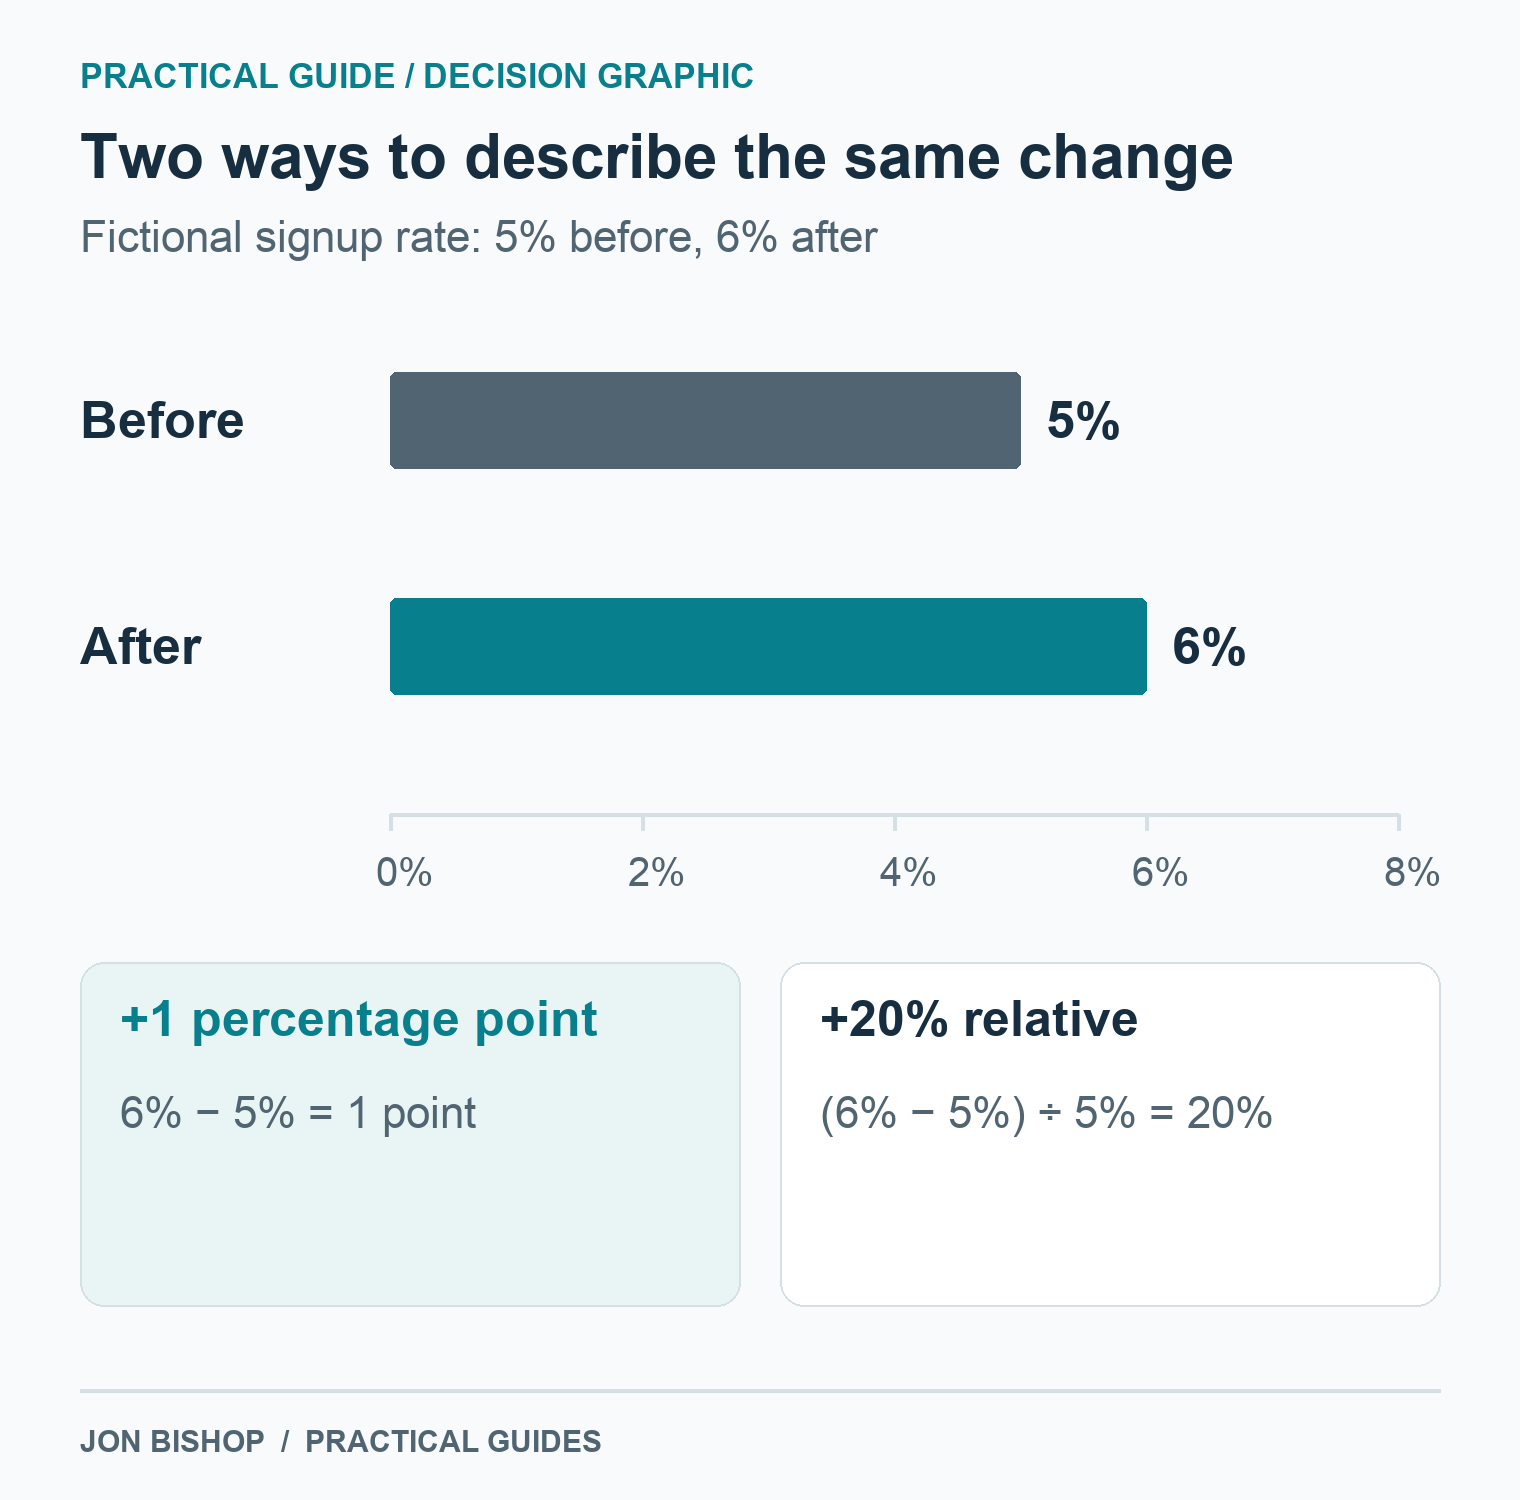
Percentage-point change subtracts the rates; relative change divides that difference by the original rate. Both describe the same fictional change, with different units.
Investigate why people stop
Inspect the experience at the step, then talk to people who succeeded and people who did not.
For signup, investigate whether visitors understand the product, trust the offer, and can complete the form. For activation, examine prerequisites, integrations, permissions, sample data, errors, and the path to a useful result. For payment, ask whether value is clear and whether packaging, buying approval, or implementation questions remain unresolved.
Break a broad step into smaller steps only when that helps diagnose a decision. Tracking every click can produce more noise without explaining the problem.
Patterns in successful users can generate hypotheses. They don't establish that copying the behavior will cause retention or payment.
Choose the next intervention
Compare candidate changes using potential impact, evidence, effort, and risk. A modest change addressing an observed error may be a better first move than a redesign justified only by a benchmark gap.
Write a brief:
- Problem and affected cohort.
- Evidence from the funnel and customer experience.
- Proposed change and why it should help.
- Expected outcome, with assumptions.
- Quality or reliability guardrails.
- Implementation owner and effort.
- Observation window and review method.
With limited traffic, you may need usability sessions, interviews, or a carefully observed rollout to learn. Don't call a noisy before/after comparison a conclusive A/B result.
The output of funnel analysis is a better decision about what to investigate or change. The chart itself is only part of the work.
Use the funnel-analysis worksheet
Download the SaaS funnel analysis worksheet. It includes measurement definitions, a funnel table, scenario comparisons, a completed fictional example, and an intervention brief.
Connect the finding to a plan
Use the channel selection guide if the problem is acquisition fit. If you need help investigating or implementing the change, use the contractor hiring guide to define the job.
This guide develops the analysis approach in Jon Bishop's data-analysis skill. All numeric examples are fictional.
Explore the SaaS growth guides and templates to choose another problem to work on.